で多くのオブジェクトを最適化
この記事はthree.jsの連載記事の1つです。最初の記事はThree.jsの基礎知識です。まだ読んでいない場合はそこから始めて下さい。
three.jsには最適化する方法は多々あります。1つの方法はジオメトリのマージと呼ばれています。メッシュを作成すると描画リクエストを1つ以上行った事を表します。 2つのメッシュを描画すると結果が同じでも1つのメッシュを描画するよりもオーバーヘッドが大きく、最適化する1つの方法がメッシュのマージです。
これが問題解決になるか、例を示してみます。 WebGL Globeを作り直してみましょう。
まずデータが必要です。WebGL Globeで使用しているデータはSEDACです。 サイトをチェックすると人口統計データのグリッド形式があります。 私は60分間の解像度データをダウンロードしました。データを見てみると以下のような感じになっています。
 ncols         360
 nrows         145
 xllcorner     -180
 yllcorner     -60
 cellsize      0.99999999999994
 NODATA_value  -9999
 -9999 -9999 -9999 -9999 -9999 -9999 -9999 -9999 -9999 -9999 -9999 -9999 ...
 -9999 -9999 -9999 -9999 -9999 -9999 -9999 -9999 -9999 -9999 -9999 -9999 ...
 -9999 -9999 -9999 -9999 -9999 -9999 -9999 -9999 -9999 -9999 -9999 -9999 ...
 -9999 -9999 -9999 -9999 -9999 -9999 -9999 -9999 -9999 -9999 -9999 -9999 ...
 -9999 -9999 -9999 -9999 -9999 -9999 -9999 -9999 -9999 -9999 -9999 -9999 ...
 -9999 -9999 -9999 -9999 -9999 -9999 -9999 -9999 -9999 -9999 -9999 -9999 ...
 -9999 -9999 -9999 -9999 -9999 -9999 -9999 -9999 -9999 -9999 -9999 -9999 ...
 -9999 -9999 -9999 -9999 -9999 -9999 -9999 -9999 -9999 -9999 -9999 -9999 ...
 -9999 -9999 -9999 -9999 -9999 -9999 -9999 -9999 -9999 -9999 -9999 -9999 ...
 -9999 -9999 -9999 -9999 -9999 -9999 -9999 -9999 -9999 -9999 -9999 -9999 ...
 -9999 -9999 -9999 -9999 -9999 -9999 -9999 -9999 -9999 -9999 -9999 -9999 ...
 -9999 -9999 -9999 -9999 -9999 -9999 -9999 -9999 -9999 -9999 -9999 -9999 ...
 -9999 -9999 -9999 -9999 -9999 -9999 -9999 -9999 -9999 -9999 -9999 -9999 ...
 9.241768 8.790958 2.095345 -9999 0.05114867 -9999 -9999 -9999 -9999 -999...
 1.287993 0.4395509 -9999 -9999 -9999 -9999 -9999 -9999 -9999 -9999 -9999...
 -9999 -9999 -9999 -9999 -9999 -9999 -9999 -9999 -9999 -9999 -9999 -9999 ...
キーと値のペアのような行がいくつかあり、その行に続くグリッドポイントごとの値の行があり、データポイントごとに1行ずつ並んでいます。 データをもっと理解するために2Dでプロットしてみましょう。
最初にテキストファイルをロードするコードです。
async function loadFile(url) {
  const res = await fetch(url);
  return res.text();
}
上記のコードは Promise を返しファイルの内容は url にあります。
次にファイルを解析するコードが必要です。
function parseData(text) {
  const data = [];
  const settings = {data};
  let max;
  let min;
  // split into lines
  text.split('\n').forEach((line) => {
    // split the line by whitespace
    const parts = line.trim().split(/\s+/);
    if (parts.length === 2) {
      // only 2 parts, must be a key/value pair
      settings[parts[0]] = parseFloat(parts[1]);
    } else if (parts.length > 2) {
      // more than 2 parts, must be data
      const values = parts.map((v) => {
        const value = parseFloat(v);
        if (value === settings.NODATA_value) {
          return undefined;
        }
        max = Math.max(max === undefined ? value : max, value);
        min = Math.min(min === undefined ? value : min, value);
        return value;
      });
      data.push(values);
    }
  });
  return Object.assign(settings, {min, max});
}
上記のコードはファイルから全てのキーと値のペアを持つオブジェクトを返します。またdata プロパティには全てのデータを1つの大きな配列にまとめて、データに含まれる min と max の値を返します。
次にデータの描画コードが必要です。
function drawData(file) {
  const {min, max, data} = file;
  const range = max - min;
  const ctx = document.querySelector('canvas').getContext('2d');
  // make the canvas the same size as the data
  ctx.canvas.width = ncols;
  ctx.canvas.height = nrows;
  // but display it double size so it's not too small
  ctx.canvas.style.width = px(ncols * 2);
  ctx.canvas.style.height = px(nrows * 2);
  // fill the canvas to dark gray
  ctx.fillStyle = '#444';
  ctx.fillRect(0, 0, ctx.canvas.width, ctx.canvas.height);
  // draw each data point
  data.forEach((row, latNdx) => {
    row.forEach((value, lonNdx) => {
      if (value === undefined) {
        return;
      }
      const amount = (value - min) / range;
      const hue = 1;
      const saturation = 1;
      const lightness = amount;
      ctx.fillStyle = hsl(hue, saturation, lightness);
      ctx.fillRect(lonNdx, latNdx, 1, 1);
    });
  });
}

function px(v) {
  return `${v | 0}px`;
}

function hsl(h, s, l) {
  return `hsl(${h * 360 | 0},${s * 100 | 0}%,${l * 100 | 0}%)`;
}
最後にすべてを統合します。
loadFile('resources/data/gpw/gpw_v4_basic_demographic_characteristics_rev10_a000_014mt_2010_cntm_1_deg.asc')
  .then(parseData)
  .then(drawData);
そして、以下のような結果が得られました。
どうやら上手くいったようです。
これを3Dでやってみましょう。 要求されたレンダリングのコードから始めてファイル内のデータごとに1つのボックスを作ります。
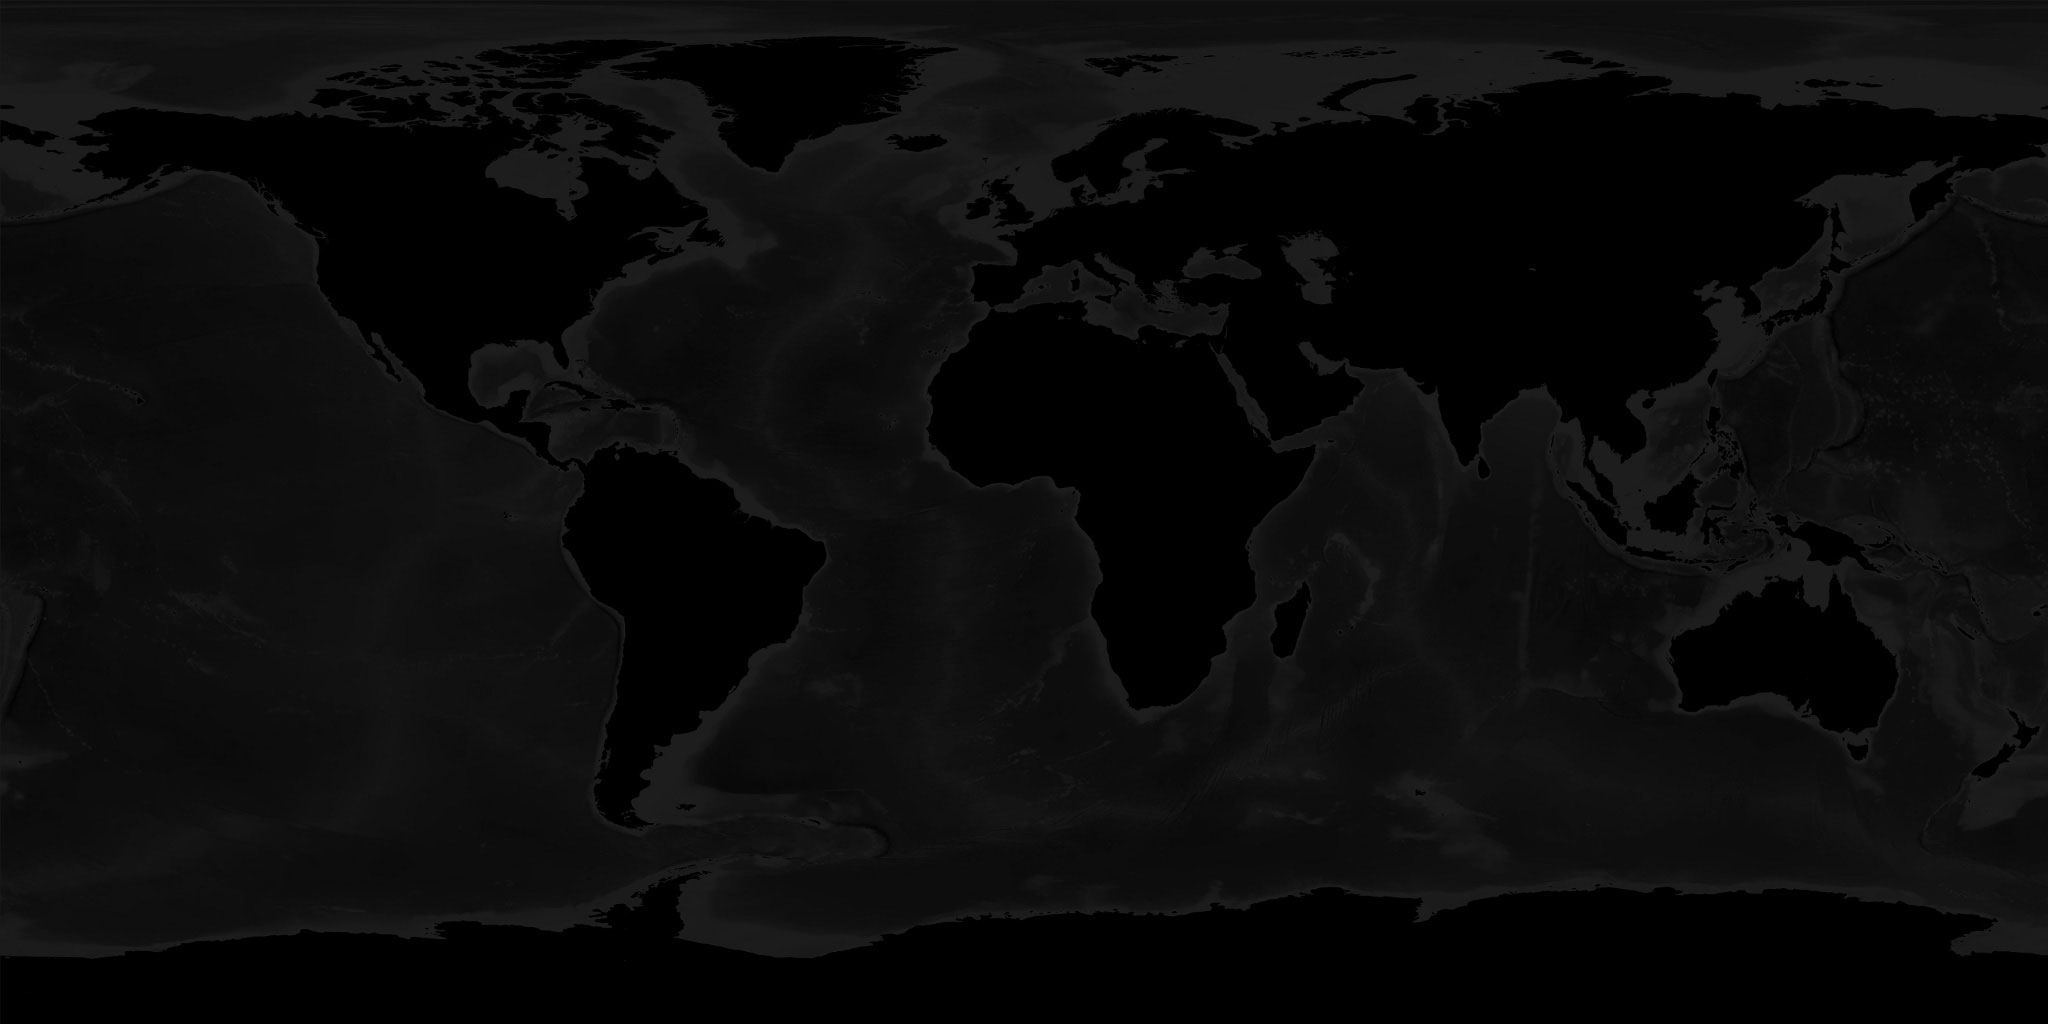
まずは世界地図テクスチャで簡単な球体を作ってみましょう。テクスチャはこんな感じです。

テクスチャをセットするコードです。
{
  const loader = new THREE.TextureLoader();
  const texture = loader.load('resources/images/world.jpg', render);
  const geometry = new THREE.SphereGeometry(1, 64, 32);
  const material = new THREE.MeshBasicMaterial({map: texture});
  scene.add(new THREE.Mesh(geometry, material));
}
テクスチャ読込後に render を呼び出している部分に注目して下さい。
renderが必要なのは連続的なレンダリングでなく、要求されたレンダリングなのでテクスチャ読込後に一度レンダリングする必要があるからです。
次に上記のデータポイントごとにドット描画するコードをデータポイントごとにボックスを作成するコードに変更する必要があります。
function addBoxes(file) {
  const {min, max, data} = file;
  const range = max - min;

  // make one box geometry
  const boxWidth = 1;
  const boxHeight = 1;
  const boxDepth = 1;
  const geometry = new THREE.BoxGeometry(boxWidth, boxHeight, boxDepth);
  // make it so it scales away from the positive Z axis
  geometry.applyMatrix4(new THREE.Matrix4().makeTranslation(0, 0, 0.5));

  // these helpers will make it easy to position the boxes
  // We can rotate the lon helper on its Y axis to the longitude
  const lonHelper = new THREE.Object3D();
  scene.add(lonHelper);
  // We rotate the latHelper on its X axis to the latitude
  const latHelper = new THREE.Object3D();
  lonHelper.add(latHelper);
  // The position helper moves the object to the edge of the sphere
  const positionHelper = new THREE.Object3D();
  positionHelper.position.z = 1;
  latHelper.add(positionHelper);

  const lonFudge = Math.PI * .5;
  const latFudge = Math.PI * -0.135;
  data.forEach((row, latNdx) => {
    row.forEach((value, lonNdx) => {
      if (value === undefined) {
        return;
      }
      const amount = (value - min) / range;
      const material = new THREE.MeshBasicMaterial();
      const hue = THREE.MathUtils.lerp(0.7, 0.3, amount);
      const saturation = 1;
      const lightness = THREE.MathUtils.lerp(0.1, 1.0, amount);
      material.color.setHSL(hue, saturation, lightness);
      const mesh = new THREE.Mesh(geometry, material);
      scene.add(mesh);

      // adjust the helpers to point to the latitude and longitude
      lonHelper.rotation.y = THREE.MathUtils.degToRad(lonNdx + file.xllcorner) + lonFudge;
      latHelper.rotation.x = THREE.MathUtils.degToRad(latNdx + file.yllcorner) + latFudge;

      // use the world matrix of the position helper to
      // position this mesh.
      positionHelper.updateWorldMatrix(true, false);
      mesh.applyMatrix4(positionHelper.matrixWorld);

      mesh.scale.set(0.005, 0.005, THREE.MathUtils.lerp(0.01, 0.5, amount));
    });
  });
}
2Dドットの描画コードからほとんどの部分が単純明快なものになっています。
1つのボックスを作り、ボックスの中心が正のZから離れるように調整します。これをしないと中心からのスケールになってしまうため、原点から離れるようになってほしいからです。
シーングラフで説明したように、多くの THREE.Object3D オブジェクトでボックスを親にして解決できますが、シーングラフにノードを追加すればするほど遅くなってしまいます。
また lonHelper、latHelper、positionHelperという小さなノード階層を設定します。
これらのオブジェクトを使用し、ボックスを配置する球体の周りの位置を計算します。
上記のgreen barは lonHelper と longHelper を表し、赤道上の経度方向に回転させるために使用します。
blue bar は latHelper を表し、赤道上や赤道下の緯度を回転させるために使用します。
red sphereは positionHelper が提供するオフセットを表します。
地球儀上の位置の計算を手動で行う事もできますが、ほとんどの計算をライブラリ自体に任せてしまうので処理をする必要がありません。
各データポイントに対して MeshBasicMaterial と Mesh を作成し、positionHelper のワールド座標を求めてそれを新しい Mesh に適用します。
最後にメッシュを新しい位置で拡大縮小します。
上記のように新しいボックスを作成する度に latHelper、lonHelper、positionHelper を作成できましたが、それではさらに時間がかかります。
これから作るボックスは360 × 145まであります。最大で52000個のボックスです。 いくつかのデータポイントが "NO_DATA "とマークされているので、実際に作成するボックスの数は約19000個です。 1ボックスごとに3つのヘルパーオブジェクトを追加した場合、シーングラフのノードが80000個近くになり、THREE.jsはその位置を計算しなければなりません。 ヘルパーの1つのセットを使用して単にメッシュを使用する事で約60000回の操作を削減できます。
また lonFudge と latFudge には注意点があります。lonFudge はπ/2で1/4回転です。
これは理にかなっています。テクスチャやテクスチャ座標が地球の周りの異なるオフセットから始まる事を意味しているだけです。
一方、latFudgeについてはなぜπ * -0.135にする必要があるのか私にはわかりません。
最後に行う必要があるのはローダーの呼出です。
loadFile('resources/data/gpw/gpw_v4_basic_demographic_characteristics_rev10_a000_014mt_2010_cntm_1_deg.asc')
  .then(parseData)
-  .then(drawData)
+  .then(addBoxes)
+  .then(render);
データ読込と解析が終わったら、少なくとも一度は要求されたレンダリングをする必要があります。
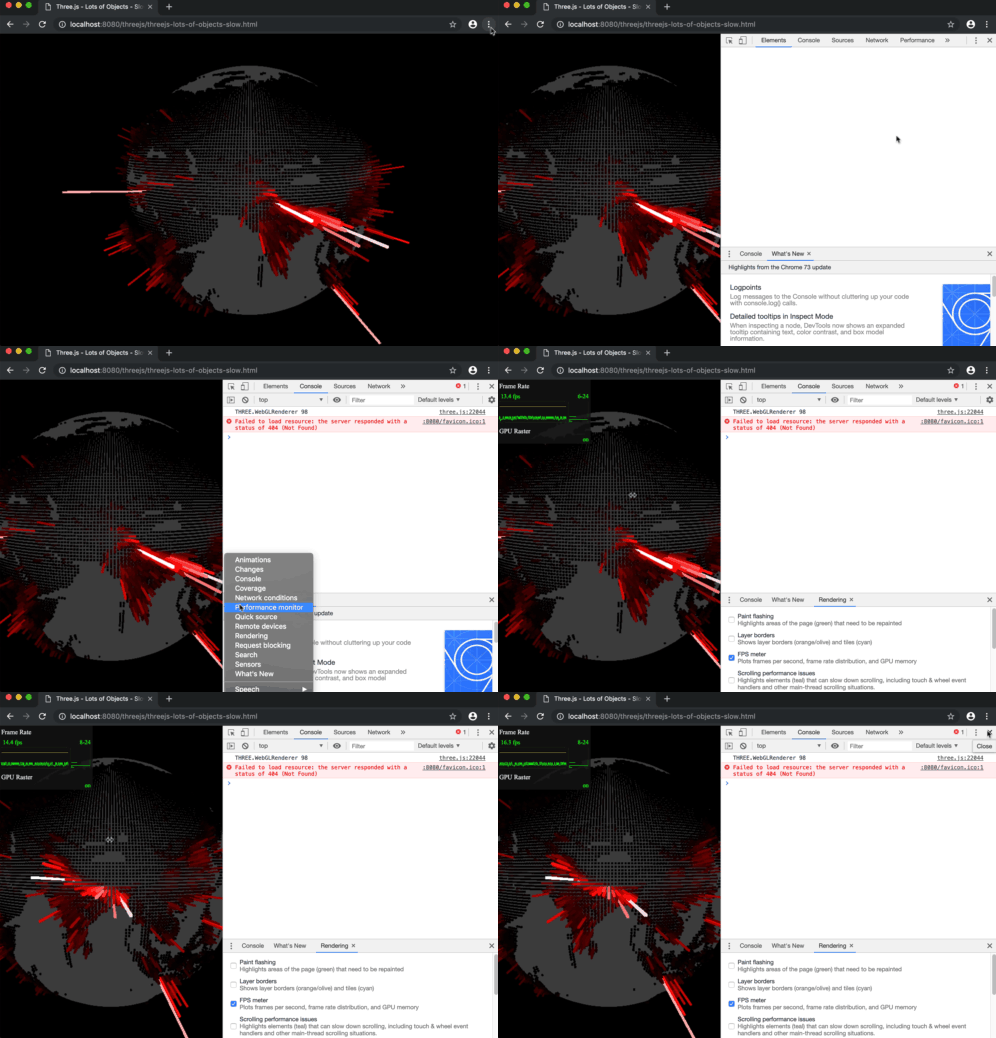
上記のサンプルをドラッグして回転させようとすると遅い事に気づくでしょう。
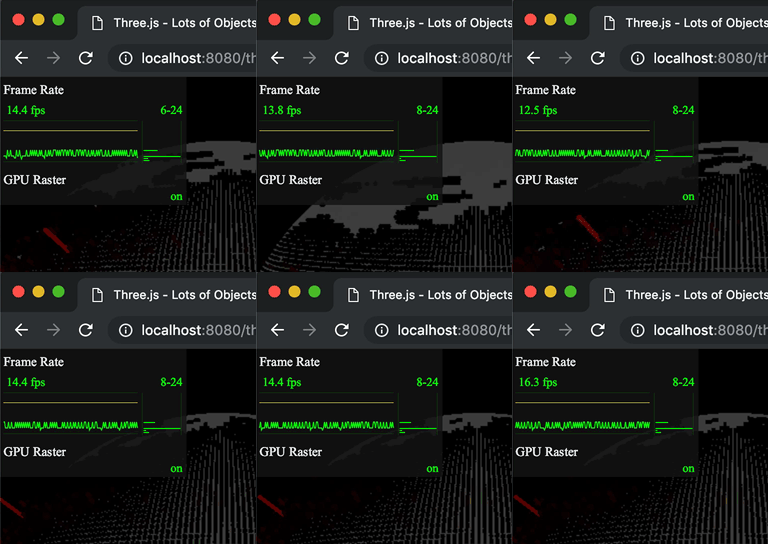
devtoolsを開いてFPS meterをオンにする事でFPSを確認できます。

私のマシンでは20fps以下のFPSが表示されています。

FPSの遅延はあまり好ましくなく、多くの人々がさらにFPSが遅くなるマシンを持っているのではないでしょうか。最適化を検討した方がいいですね。
このFPS遅延の問題解決では、全てのボックスを1つのジオメトリに統合する事ができます。 現在は19000個前後のボックスを描画してます。1つのジオメトリに統合する事で18999個の操作を削除する事ができます。
以下はボックスを1つのジオメトリに統合する新しいコードです。
function addBoxes(file) {
  const {min, max, data} = file;
  const range = max - min;

-  // make one box geometry
-  const boxWidth = 1;
-  const boxHeight = 1;
-  const boxDepth = 1;
-  const geometry = new THREE.BoxGeometry(boxWidth, boxHeight, boxDepth);
-  // make it so it scales away from the positive Z axis
-  geometry.applyMatrix4(new THREE.Matrix4().makeTranslation(0, 0, 0.5));

  // these helpers will make it easy to position the boxes
  // We can rotate the lon helper on its Y axis to the longitude
  const lonHelper = new THREE.Object3D();
  scene.add(lonHelper);
  // We rotate the latHelper on its X axis to the latitude
  const latHelper = new THREE.Object3D();
  lonHelper.add(latHelper);
  // The position helper moves the object to the edge of the sphere
  const positionHelper = new THREE.Object3D();
  positionHelper.position.z = 1;
  latHelper.add(positionHelper);
+  // Used to move the center of the box so it scales from the position Z axis
+  const originHelper = new THREE.Object3D();
+  originHelper.position.z = 0.5;
+  positionHelper.add(originHelper);

  const lonFudge = Math.PI * .5;
  const latFudge = Math.PI * -0.135;
+  const geometries = [];
  data.forEach((row, latNdx) => {
    row.forEach((value, lonNdx) => {
      if (value === undefined) {
        return;
      }
      const amount = (value - min) / range;

-      const material = new THREE.MeshBasicMaterial();
-      const hue = THREE.MathUtils.lerp(0.7, 0.3, amount);
-      const saturation = 1;
-      const lightness = THREE.MathUtils.lerp(0.1, 1.0, amount);
-      material.color.setHSL(hue, saturation, lightness);
-      const mesh = new THREE.Mesh(geometry, material);
-      scene.add(mesh);

+      const boxWidth = 1;
+      const boxHeight = 1;
+      const boxDepth = 1;
+      const geometry = new THREE.BoxGeometry(boxWidth, boxHeight, boxDepth);

      // adjust the helpers to point to the latitude and longitude
      lonHelper.rotation.y = THREE.MathUtils.degToRad(lonNdx + file.xllcorner) + lonFudge;
      latHelper.rotation.x = THREE.MathUtils.degToRad(latNdx + file.yllcorner) + latFudge;

-      // use the world matrix of the position helper to
-      // position this mesh.
-      positionHelper.updateWorldMatrix(true, false);
-      mesh.applyMatrix4(positionHelper.matrixWorld);
-
-      mesh.scale.set(0.005, 0.005, THREE.MathUtils.lerp(0.01, 0.5, amount));

+      // use the world matrix of the origin helper to
+      // position this geometry
+      positionHelper.scale.set(0.005, 0.005, THREE.MathUtils.lerp(0.01, 0.5, amount));
+      originHelper.updateWorldMatrix(true, false);
+      geometry.applyMatrix4(originHelper.matrixWorld);
+
+      geometries.push(geometry);
    });
  });

+  const mergedGeometry = BufferGeometryUtils.mergeBufferGeometries(
+      geometries, false);
+  const material = new THREE.MeshBasicMaterial({color:'red'});
+  const mesh = new THREE.Mesh(mergedGeometry, material);
+  scene.add(mesh);

}
上記ではボックスジオメトリの中心点を変更していたコードを削除し、代わりに originHelper を追加しています。
前は同じジオメトリを19000回も使っていました。
今回は1つ1つのジオメトリを新しく作成し、各ボックスジオメトリの頂点を移動するために applyMatrix を使用するので、2回ではなく1回にした方が良いかもしれません。
最後に全てのジオメトリの配列を BufferGeometryUtils.mergeBufferGeometries に渡します。
また BufferGeometryUtils も含める必要があります。
import * as BufferGeometryUtils from '/examples/jsm/utils/BufferGeometryUtils.js';
少なくとも私のマシンでは毎秒60フレームになりました。
これで上手くいったのですが、以前はそれぞれのボックスに異なる色がありましたが、1つのメッシュなので1つのマテリアルとなり1つの色だけになります。 これは頂点カラーを使い修正できます。
頂点カラーは頂点ごとに色を追加します。各ボックスの各頂点の全ての色を特定の色に設定する事で、全てのボックスが異なる色を持つようになります。
+const color = new THREE.Color();

const lonFudge = Math.PI * .5;
const latFudge = Math.PI * -0.135;
const geometries = [];
data.forEach((row, latNdx) => {
  row.forEach((value, lonNdx) => {
    if (value === undefined) {
      return;
    }
    const amount = (value - min) / range;

    const boxWidth = 1;
    const boxHeight = 1;
    const boxDepth = 1;
    const geometry = new THREE.BoxGeometry(boxWidth, boxHeight, boxDepth);

    // adjust the helpers to point to the latitude and longitude
    lonHelper.rotation.y = THREE.MathUtils.degToRad(lonNdx + file.xllcorner) + lonFudge;
    latHelper.rotation.x = THREE.MathUtils.degToRad(latNdx + file.yllcorner) + latFudge;

    // use the world matrix of the origin helper to
    // position this geometry
    positionHelper.scale.set(0.005, 0.005, THREE.MathUtils.lerp(0.01, 0.5, amount));
    originHelper.updateWorldMatrix(true, false);
    geometry.applyMatrix4(originHelper.matrixWorld);

+    // compute a color
+    const hue = THREE.MathUtils.lerp(0.7, 0.3, amount);
+    const saturation = 1;
+    const lightness = THREE.MathUtils.lerp(0.4, 1.0, amount);
+    color.setHSL(hue, saturation, lightness);
+    // get the colors as an array of values from 0 to 255
+    const rgb = color.toArray().map(v => v * 255);
+
+    // make an array to store colors for each vertex
+    const numVerts = geometry.getAttribute('position').count;
+    const itemSize = 3;  // r, g, b
+    const colors = new Uint8Array(itemSize * numVerts);
+
+    // copy the color into the colors array for each vertex
+    colors.forEach((v, ndx) => {
+      colors[ndx] = rgb[ndx % 3];
+    });
+
+    const normalized = true;
+    const colorAttrib = new THREE.BufferAttribute(colors, itemSize, normalized);
+    geometry.setAttribute('color', colorAttrib);

    geometries.push(geometry);
  });
});
上記のコードではジオメトリから position を取得して必要な頂点の数を調べています。
次に色を入れるための変数を Uint8Array で作成します。その後に geometry.setAttribute を呼び出して属性として追加します。
最後に頂点カラーを扱うようにthree.jsで指定する必要があります。
const mergedGeometry = BufferGeometryUtils.mergeBufferGeometries(
    geometries, false);
-const material = new THREE.MeshBasicMaterial({color:'red'});
+const material = new THREE.MeshBasicMaterial({
+  vertexColors: true,
+});
const mesh = new THREE.Mesh(mergedGeometry, material);
scene.add(mesh);
これで色を取り戻す事ができました。
ジオメトリのマージは一般的な最適化手法です。 例えば100本の木を1つのジオメトリに統合したり、個々の岩の山を1つの岩のジオメトリに統合したり、個々の杭から1つの柵メッシュに統合したりする事ができます。 別の例としてマインクラフトではそれぞれのキューブを個別に描画するのではなく、マージされたキューブのグループを作成したり描画されない面は選択的に削除したりします。
全てを1つのメッシュにする問題点としては、以前は分離されていた部分を移動する事が容易ではなくなった事です。 ユースケースに応じて創造的なソリューションがあります。 1つは別の記事で紹介します。