Debugging JavaScript
Most of this article is not directly about THREE.js but is rather about debugging JavaScript in general. It seemed important in that many people just starting with THREE.js are also just starting with JavaScript so I hope this can help them more easily solve any issues they run into.
Debugging is a big topic and I probably can't begin to cover everything there is to know but if you're new to JavaScript then here's an attempt to give a few pointers. I strongly suggest you take some time to learn them. They'll help you enormously in your learning.
Learn your Browser's Developer Tools
All browsers have developer tools. Chrome, Firefox, Safari, Edge.
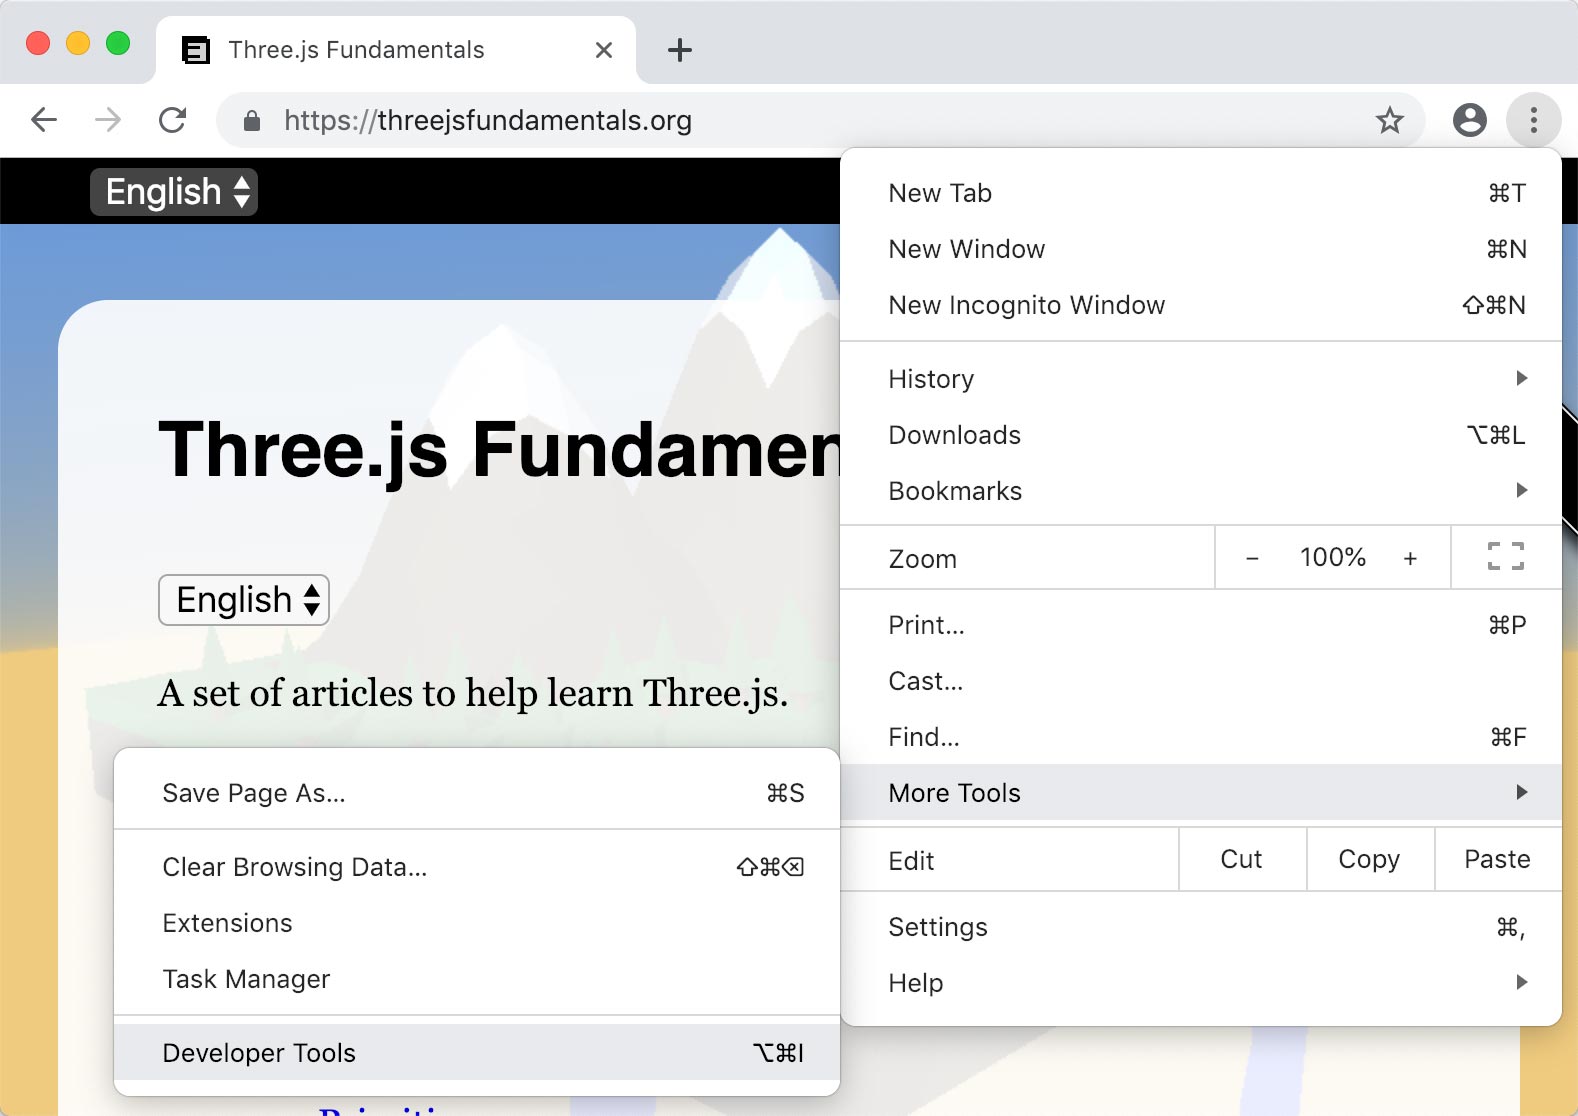
In Chrome you can click the the ⋮ icon, pick More Tools->Developer Tools
to get to the developer tools. A keyboard shortcut is also shown there.
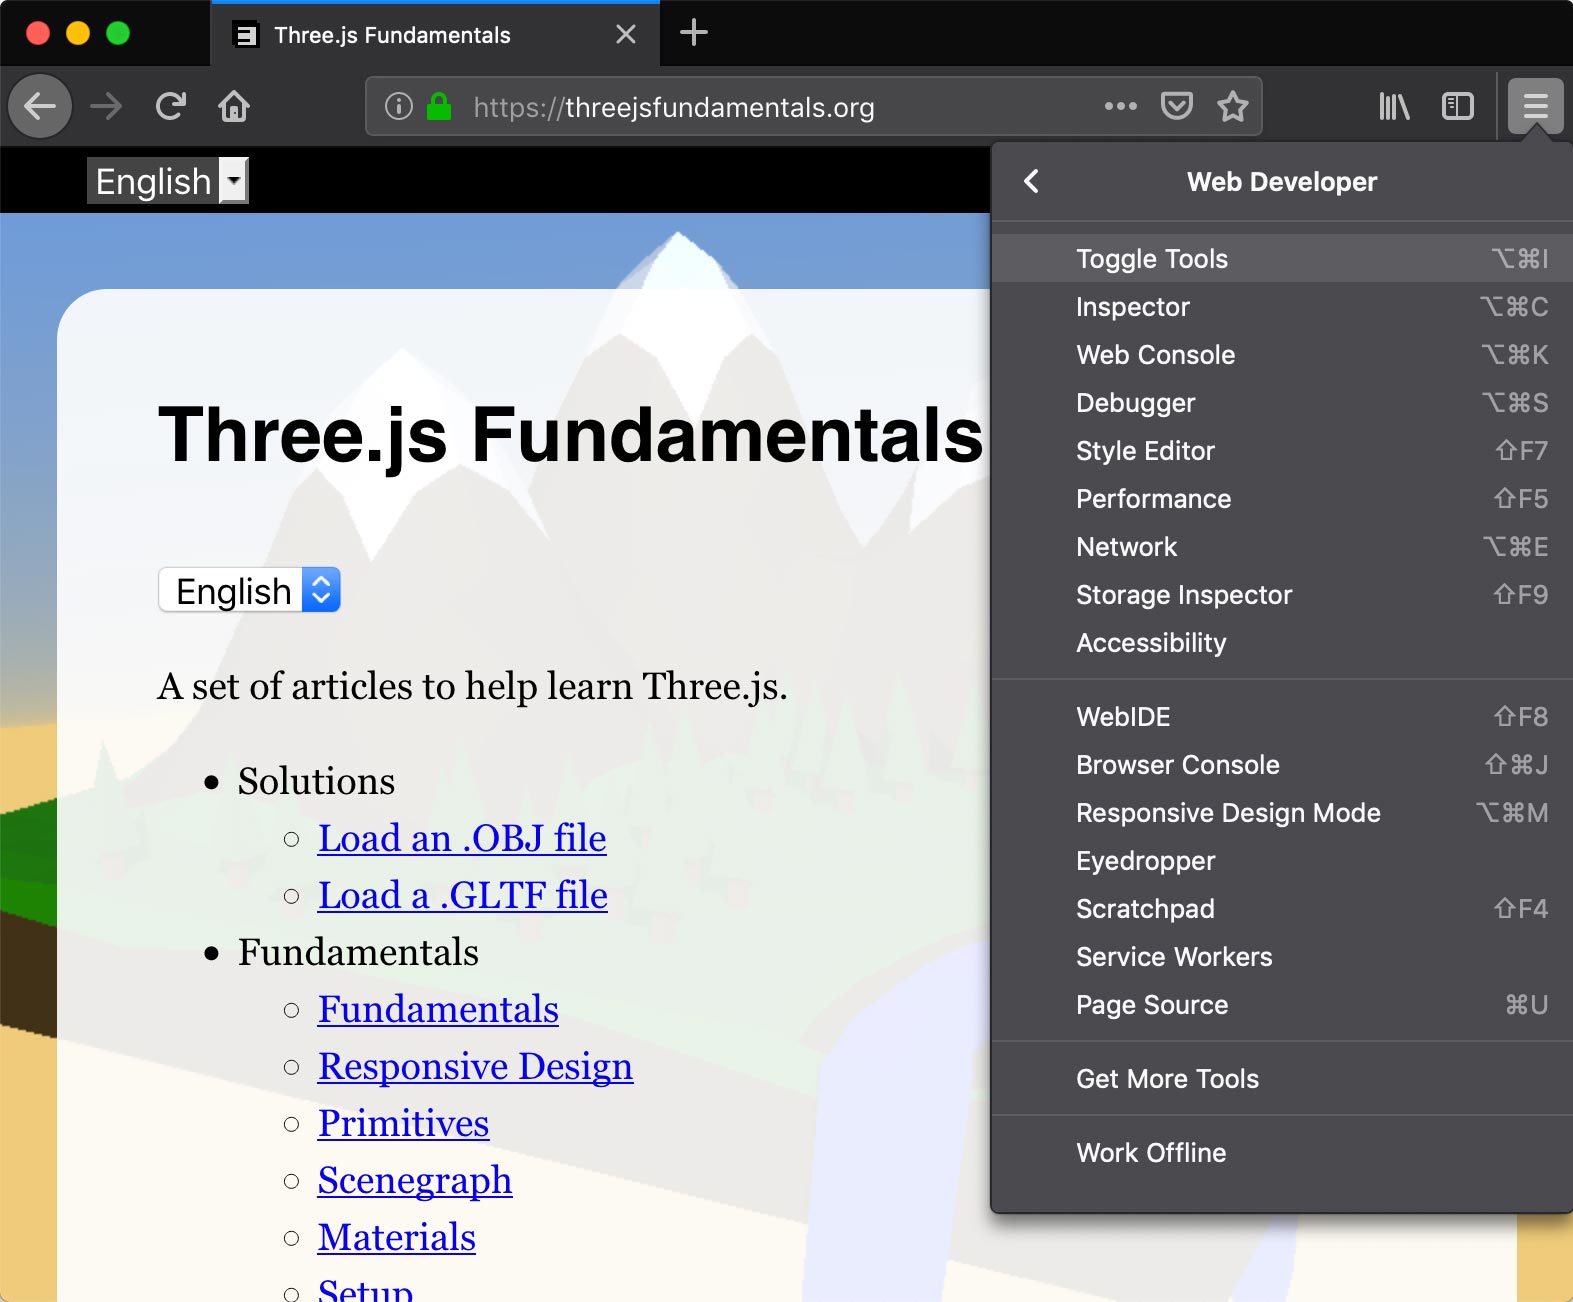
In Firefox you click the ☰ icon, pick "Web Developer", then pick
"Toggle Tools"
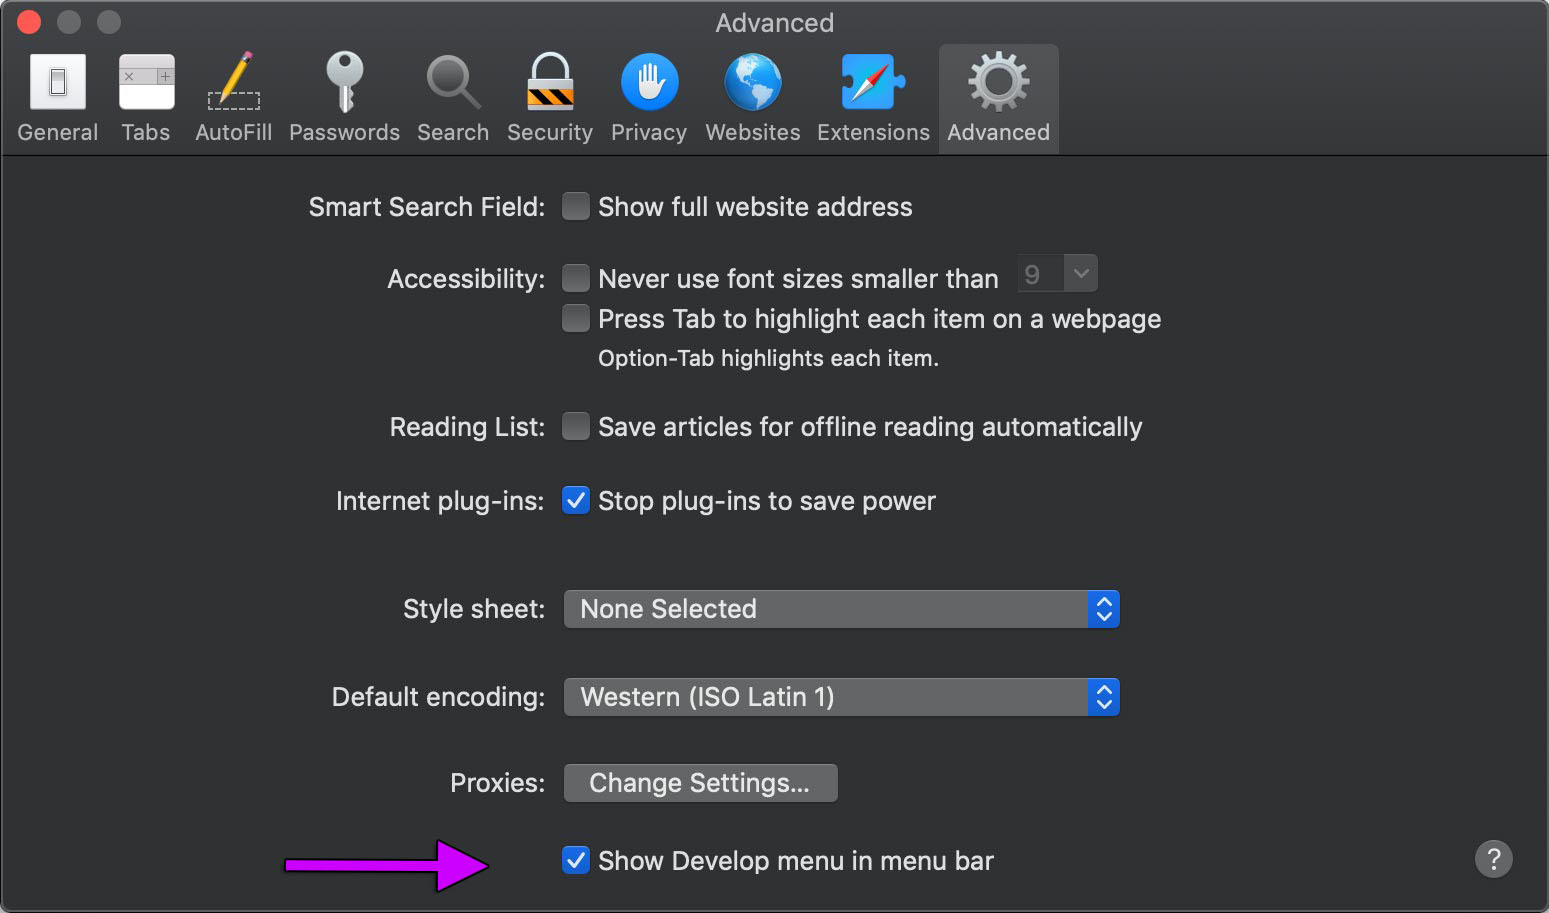
In Safari you first have to enable the Develop menu from the Advanced Safari Preferences.
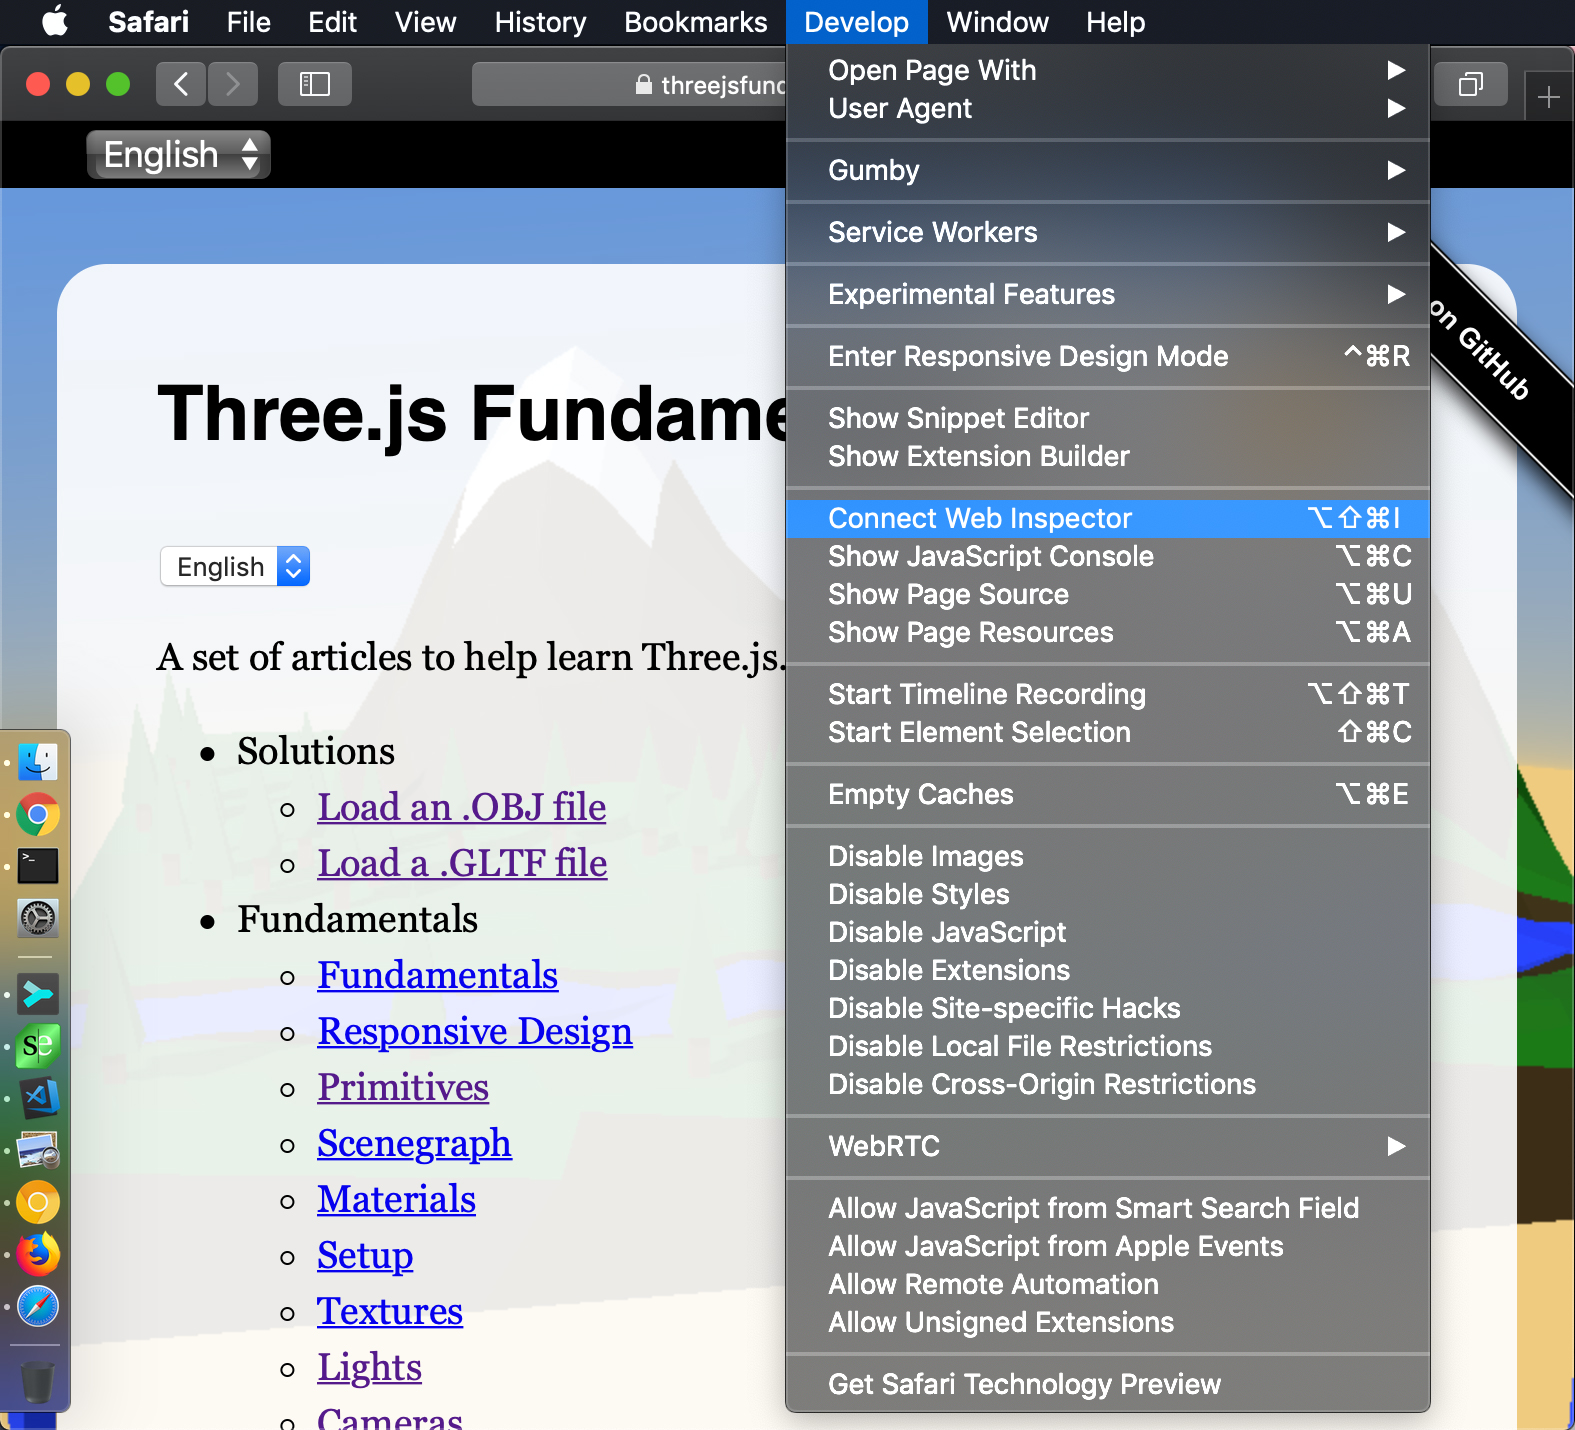
Then in the Develop menu you can pick "Show/Connect Web Inspector".
With Chrome you can also use Chrome on your computer to debug webpages running on Chrome on your Android phone or tablet. Similarly with Safari you can use your computer to debug webpages running on Safari on iPhones and iPads.
I'm most familiar with Chrome so this guide will be using Chrome as an example when referring to tools but most browsers have similar features so it should be easy to apply anything here to all browsers.
Turn off the cache
Browsers try to reuse data they've already downloaded. This is great for users so if you visit a website a second time many of the files used to display the site will not have be downloaded again.
On the other hand this can be bad for web development. You change a file on your computer, reload the page, and you don't see the changes because the browser uses the version it got last time.
One solution during web development is to turn off the cache. This way the browser will always get the newest versions of your files.
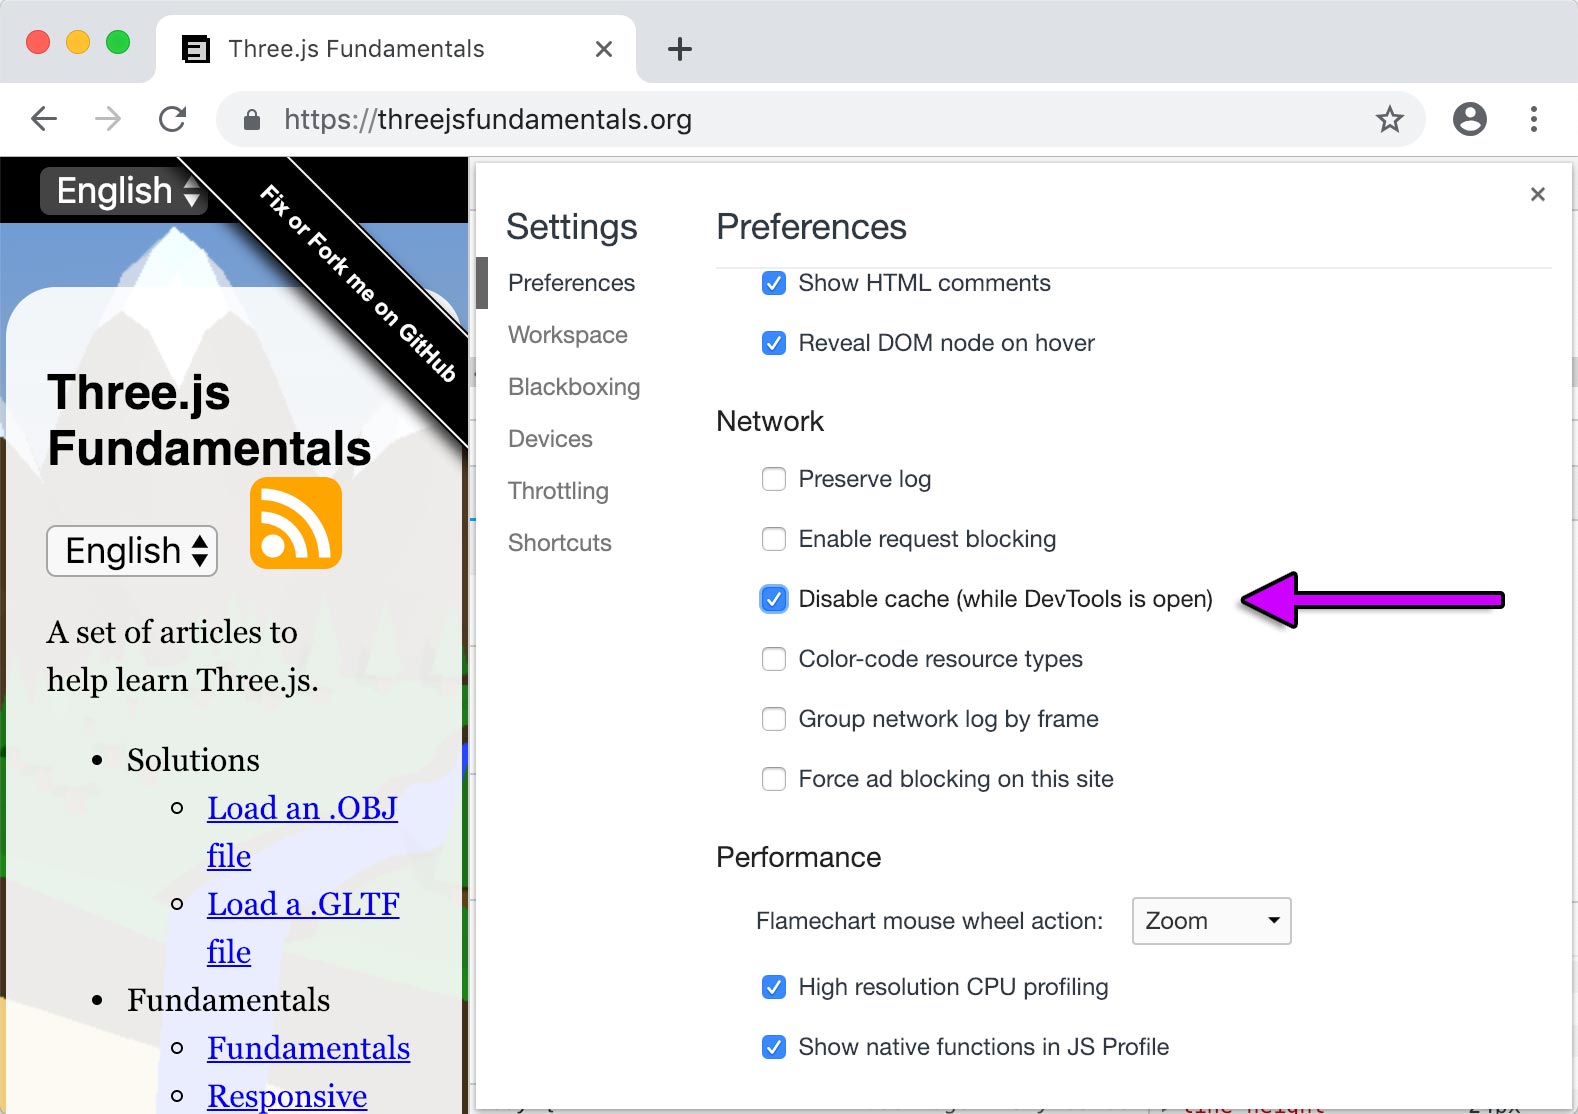
First pick settings from the corner menu
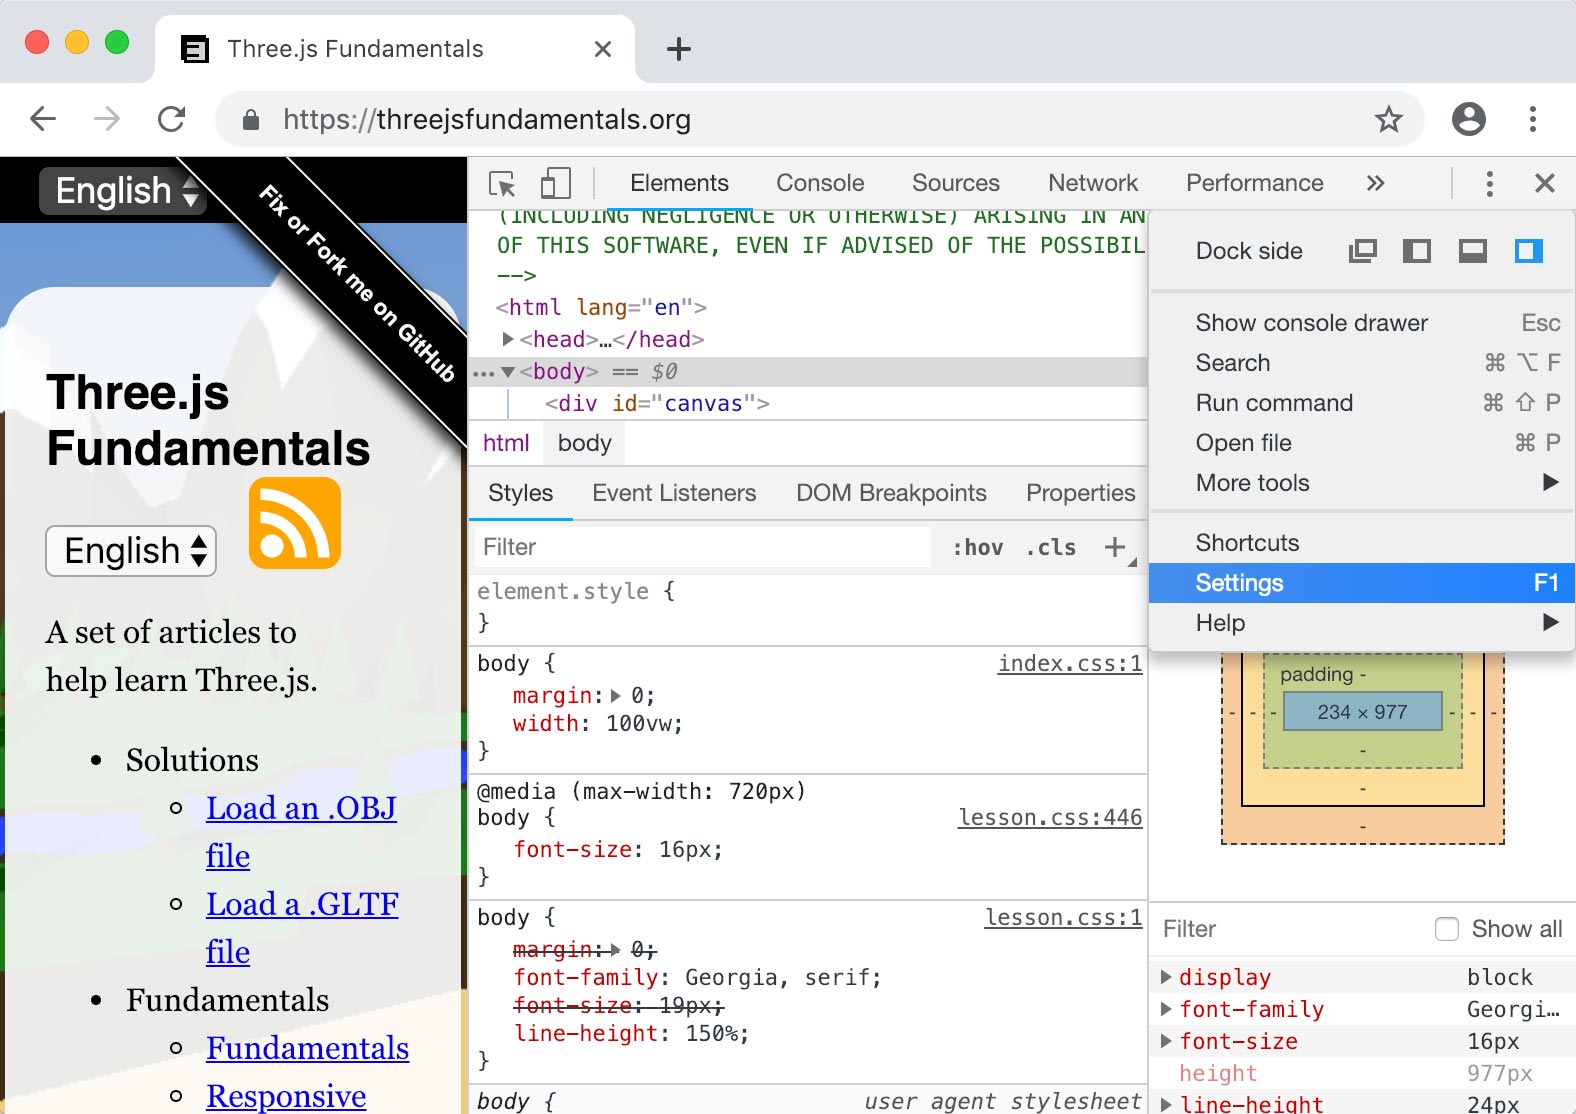
Then pick "Disable Cache (while DevTools is open)".
Use the JavaScript console
Inside all devtools is a console. It shows warnings and error messages.
READ THE MESSAGES!!
Typically there should be only 1 or 2 messages.
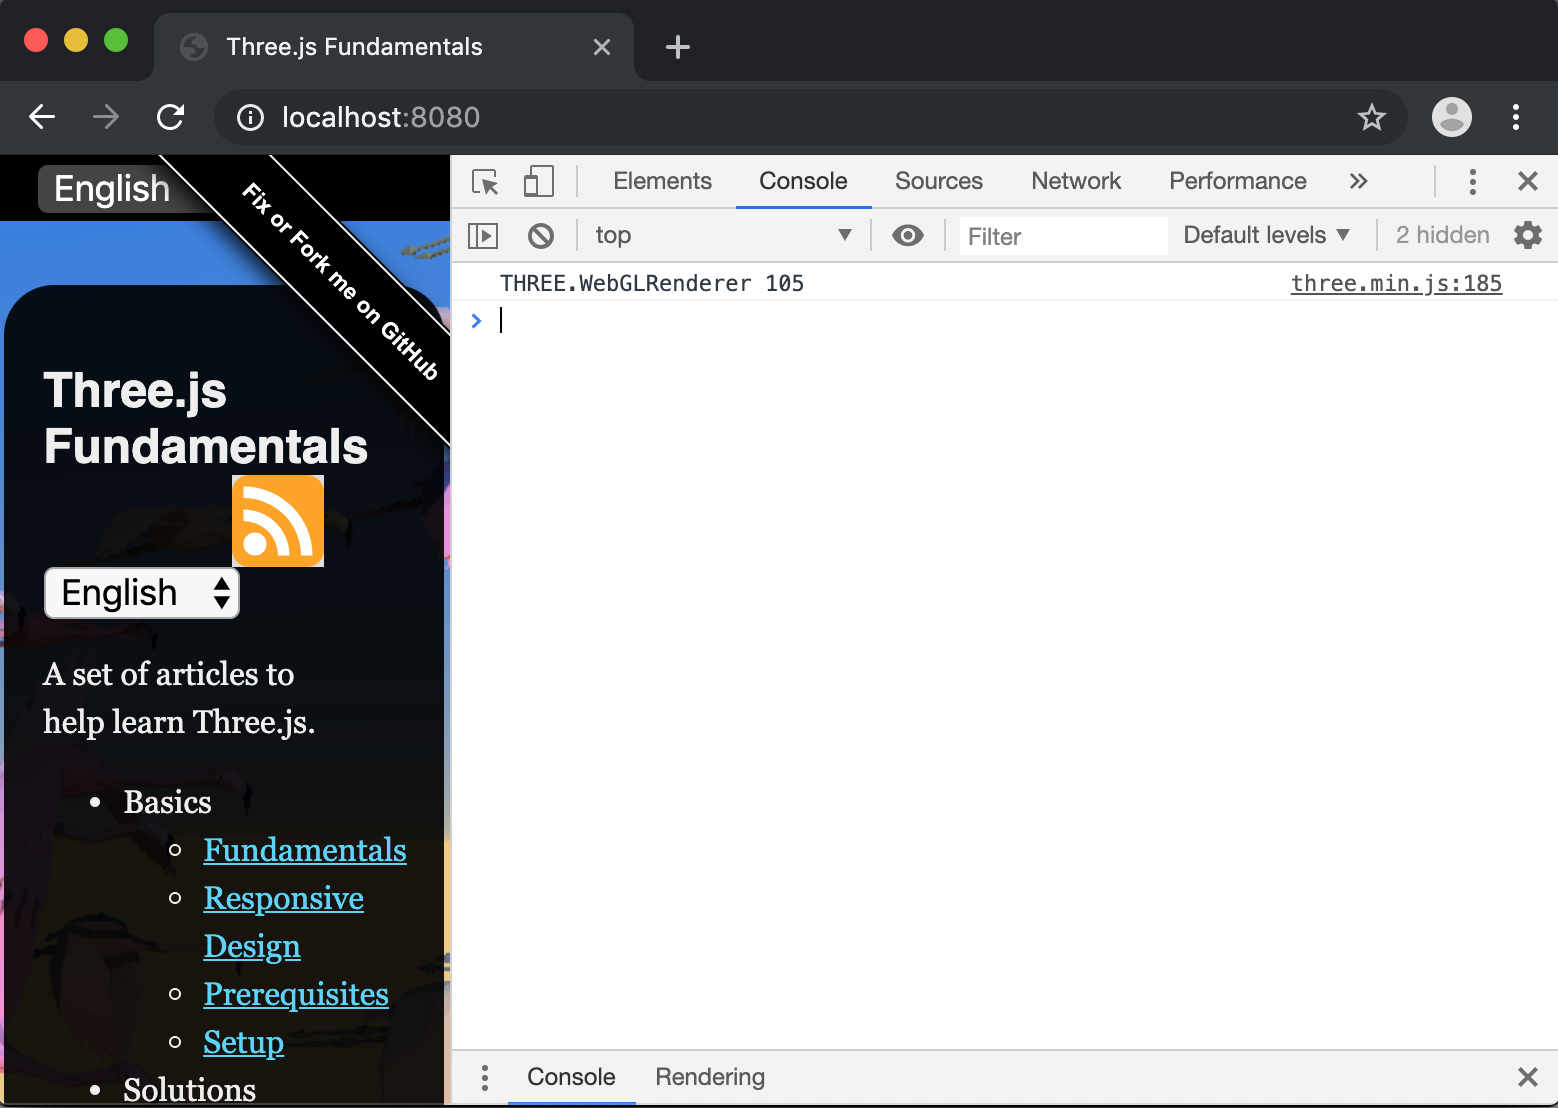
If you see any others READ THEM. For example:
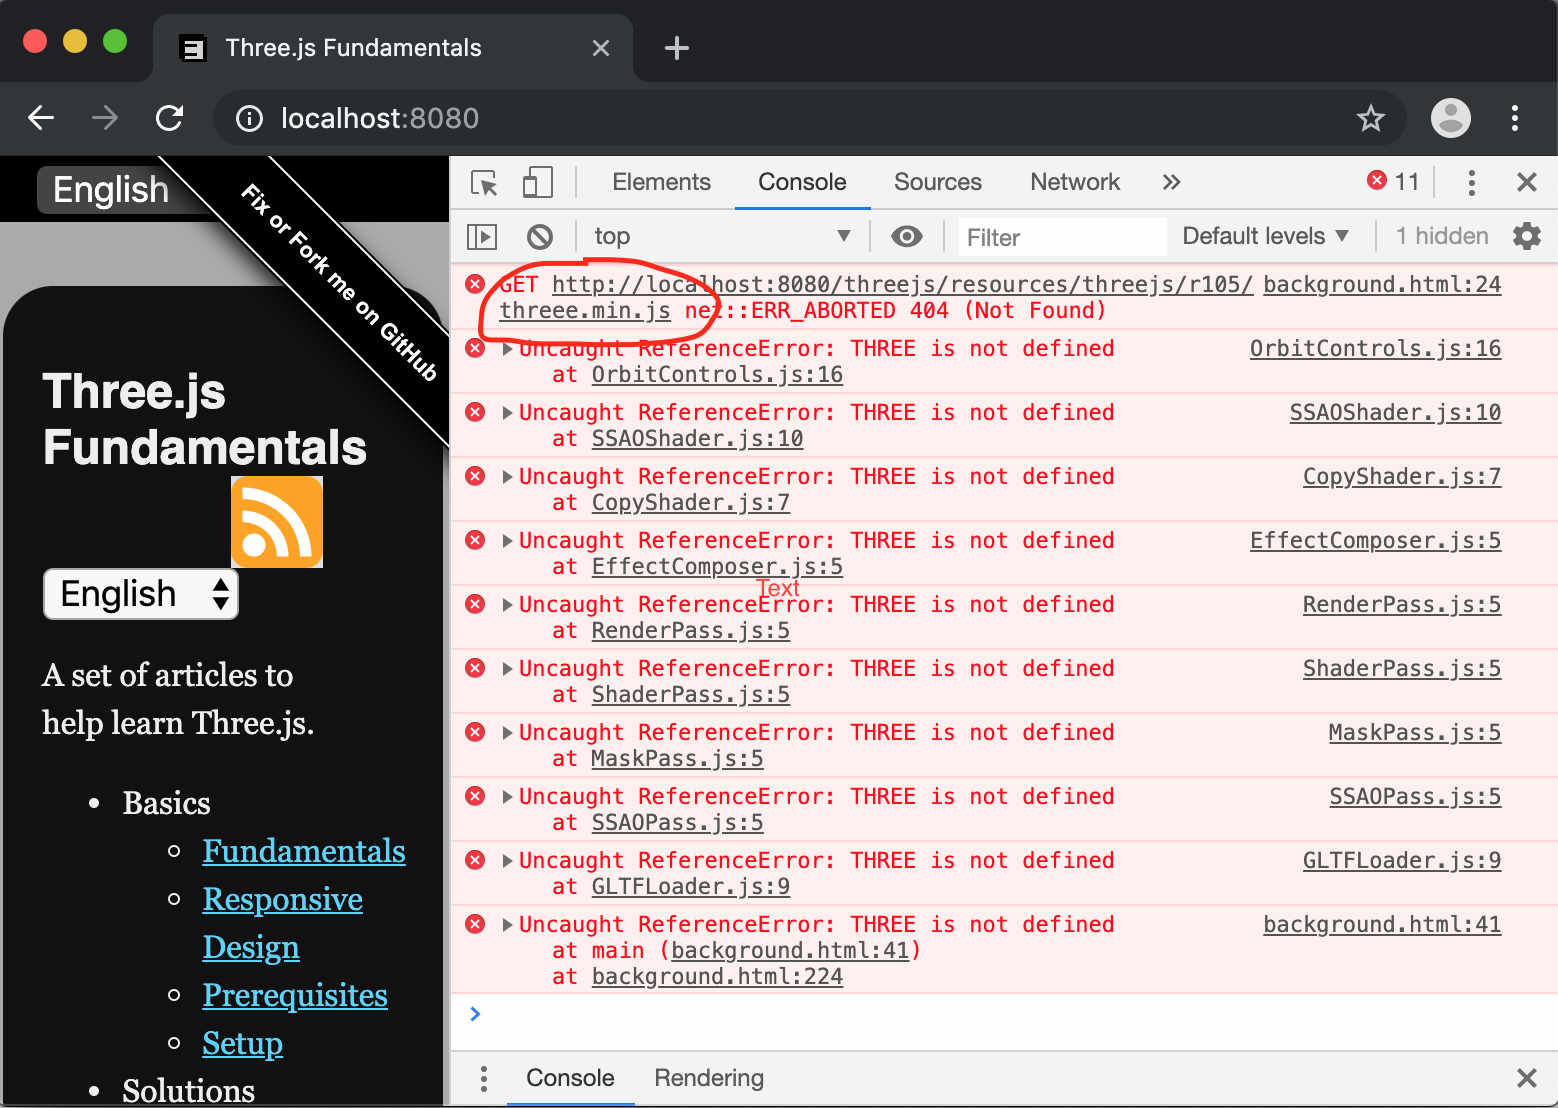
I mis-spelled "three" as "threee"
You can also print your own info to the console with with console.log as in
console.log(someObject.position.x, someObject.position.y, someObject.position.z);
Even cooler, if you log an object you can inspect it. For example if we log the root scene object from the gLTF article
  {
    const gltfLoader = new GLTFLoader();
    gltfLoader.load('resources/models/cartoon_lowpoly_small_city_free_pack/scene.gltf', (gltf) => {
      const root = gltf.scene;
      scene.add(root);
+      console.log(root);
Then we can expand that object in the JavaScript console
You can also use console.error which reports the message in red
in includes a stack trace.
Put data on screen
Another obvious but often overlooked way is to add <div> or <pre> tags
and put data in them.
The most obvious way is to make some HTML elements
<canvas id="c"></canvas>
+<div id="debug">
+  <div>x:<span id="x"></span></div>
+  <div>y:<span id="y"></span></div>
+  <div>z:<span id="z"></span></div>
+</div>
Style them so they stay on top of the canvas. (assuming your canvas fills the page)
<style>
#debug {
  position: absolute;
  left: 1em;
  top: 1em;
  padding: 1em;
  background: rgba(0, 0, 0, 0.8);
  color: white;
  font-family: monospace;
}
</style>
And then looking the elements up and setting their content.
// at init time
const xElem = document.querySelector('#x');
const yElem = document.querySelector('#y');
const zElem = document.querySelector('#z');

// at render or update time
xElem.textContent = someObject.position.x.toFixed(3);
yElem.textContent = someObject.position.y.toFixed(3);
zElem.textContent = someObject.position.z.toFixed(3);
This is more useful for real time values
Another way to put data on the screen is to make a clearing logger. I just made that term up but lots of games I've worked on have used this solution. The idea is you have a buffer that displays messages for only one frame. Any part of your code that wants to display data calls some function to add data to that buffer every frame. This is much less work than making an element per piece of data above.
For example let's change the HTML from above to just this
<canvas id="c"></canvas>
<div id="debug">
  <pre></pre>
</div>
And let's make simple class to manage this clear back buffer.
class ClearingLogger {
  constructor(elem) {
    this.elem = elem;
    this.lines = [];
  }
  log(...args) {
    this.lines.push([...args].join(' '));
  }
  render() {
    this.elem.textContent = this.lines.join('\n');
    this.lines = [];
  }
}
Then let's make a simple example that every time we click the mouse makes a mesh that moves in a random direction for 2 seconds. We'll start with one of the examples from the article on making things responsive
Here's the code that adds a new Mesh every time we click the mouse
const geometry = new THREE.SphereGeometry();
const material = new THREE.MeshBasicMaterial({color: 'red'});

const things = [];

function rand(min, max) {
  if (max === undefined) {
    max = min;
    min = 0;
  }
  return Math.random() * (max - min) + min;
}

function createThing() {
  const mesh = new THREE.Mesh(geometry, material);
  scene.add(mesh);
  things.push({
    mesh,
    timer: 2,
    velocity: new THREE.Vector3(rand(-5, 5), rand(-5, 5), rand(-5, 5)),
  });
}

canvas.addEventListener('click', createThing);
And here's the code that moves the meshes we created, logs them, and removes them when their timer has run out
const logger = new ClearingLogger(document.querySelector('#debug pre'));

let then = 0;
function render(now) {
  now *= 0.001;  // convert to seconds
  const deltaTime = now - then;
  then = now;

  ...

  logger.log('fps:', (1 / deltaTime).toFixed(1));
  logger.log('num things:', things.length);
  for (let i = 0; i < things.length;) {
    const thing = things[i];
    const mesh = thing.mesh;
    const pos = mesh.position;
    logger.log(
        'timer:', thing.timer.toFixed(3),
        'pos:', pos.x.toFixed(3), pos.y.toFixed(3), pos.z.toFixed(3));
    thing.timer -= deltaTime;
    if (thing.timer <= 0) {
      // remove this thing. Note we don't advance `i`
      things.splice(i, 1);
      scene.remove(mesh);
    } else {
      mesh.position.addScaledVector(thing.velocity, deltaTime);
      ++i;
    }
  }

  renderer.render(scene, camera);
  logger.render();

  requestAnimationFrame(render);
}
Now click the mouse a bunch in the example below
Query Parameters
Another thing to remember is that webpages can have data passed into them either via query parameters or the anchor, sometimes called the search and the hash.
https://domain/path/?query#anchor
You can use this to make features optional or pass in parameters.
For example let's take the previous example and make it so
the debug stuff only shows up if we put ?debug=true in the URL.
First we need some code to parse the query string
/**
  * Returns the query parameters as a key/value object.
  * Example: If the query parameters are
  *
  *    abc=123&def=456&name=gman
  *
  * Then `getQuery()` will return an object like
  *
  *    {
  *      abc: '123',
  *      def: '456',
  *      name: 'gman',
  *    }
  */
function getQuery() {
  return Object.fromEntries(new URLSearchParams(window.location.search).entries());
}
Then we might make the debug element not show by default
<canvas id="c"></canvas>
+<div id="debug" style="display: none;">
  <pre></pre>
</div>
Then in the code we read the params and choose to un-hide the
debug info if and only if ?debug=true is passed in
const query = getQuery();
const debug = query.debug === 'true';
const logger = debug
   ? new ClearingLogger(document.querySelector('#debug pre'))
   : new DummyLogger();
if (debug) {
  document.querySelector('#debug').style.display = '';
}
We also made a DummyLogger that does nothing and chose to use it if ?debug=true has not been passed in.
class DummyLogger {
  log() {}
  render() {}
}
You can see if we use this url:
there is no debug info but if we use this url:
debug-js-params.html?debug=true
there is debug info.
Multiple parameters can be passed in by separating with '&' as in somepage.html?someparam=somevalue&someotherparam=someothervalue.
Using parameters like this we can pass in all kinds of options. Maybe speed=0.01 to slow down our app for making it easier to understand something or showHelpers=true for whether or not to add helpers
that show the lights, shadow, or camera frustum seen in other lessons.
Learn to use the Debugger
Every browser has a debugger where you can pause your program step through line by line and inspect all the variables.
Teaching you how to use a debugger is too big a topic for this article but here's a few links
- Get Started with Debugging JavaScript in Chrome DevTools
- Debugging in Chrome
- Tips and Tricks for Debugging in Chrome Developer Tools
Check for NaN in the debugger or elsewhere
NaN is short for Not A Number. It's what JavaScript will assign
as a value when you do something that doesn't make sense mathwise.
As a simple example

Often when I'm making something and nothing appears on the screen
I'll check some values and if I see NaN I will instantly have a
place to start looking.
As an example when I first started making the path for the
article about loading gLTF files I made
a curve using the SplineCurve class which makes a 2D curve.
I then used that curve to move the cars like this
curve.getPointAt(zeroToOnePointOnCurve, car.position);
Internally curve.getPointAt calls the set function
on the object passed as the second argument. In this case that
second argument is car.position which is a Vector3. Vector3's
set function requires 3 arguments, x, y, and z but SplineCurve is a 2D curve
and so it calls car.position.set with just x and y.
The result is that car.position.set sets x to x, y to y, and z to undefined.
A quick glance in the debugger looking at the car's matrixWorld
showed a bunch of NaN values.
Seeing the matrix had NaNs in it suggested something like position,
rotation, scale or some other function that affects that matrix had bad
data. Working backward from their it was easy to track down the issue.
In top of NaN there's also Infinity which is a similar sign there
is a math bug somewhere.
Look In the Code!
THREE.js is Open Source. Don't be afraid to look inside the code! You can look inside on github. You can also look inside by stepping into functions in the debugger.
Put requestAnimationFrame at bottom of your render function.
I see this pattern often
function render() {
   requestAnimationFrame(render);

   // -- do stuff --

   renderer.render(scene, camera);
}
requestAnimationFrame(render);
I'd suggest that putting the call to requestAnimationFrame at
the bottom as in
function render() {
   // -- do stuff --

   renderer.render(scene, camera);

   requestAnimationFrame(render);
}
requestAnimationFrame(render);
The biggest reason is it means your code will stop if you have an error. Putting
requestAnimationFrame at the top means your code will keep running even if you
have an error since you already requested another frame. IMO it's better to find
those errors than to ignore them. They could easily be the reason something is
not appearing as you expect it to but unless your code stops you might not even
notice.
Check your units!
This basically means knowing for example when to use degrees vs when to use radians. It's unfortunate that THREE.js does not consistently use the same units everywhere. Off the top of my head the camera's field of view is in degrees. All other angles are in radians.
The other place to look out is your world unit size. Until recently 3D apps could choose any unit size they wanted. One app might choose 1 unit = 1cm. Another might choose 1 unit = 1 foot. It's actually still true that you can chose any units you want for certain applications. That said, THREE.js assumes 1 unit = 1 meter. This is important for things like physically based rendering which uses meters to compute lighting effects. It's also important for AR and VR which need to deal with real world units like where your phone is or where the VR controllers are.
Making a Minimal, Complete, Verifiable, Example for Stack Overflow
If you decide to ask a question about THREE.js it's almost always required for you to provide an MCVE which stands for Minimal, Complete, Verifiable, Example.
The Minimal part is important. Let's say you where having an issue with the path movement in the last example of the loading a gLTF article. That example has many parts. Listing them out it has
- A bunch of HTML
- Some CSS
- Lights
- Shadows
- lil-gui code to manipulate shadows
- Code to load a .GLTF file
- Code to resize the canvas.
- Code to move the cars along paths
That's pretty huge. If your question is only about the path following part you
can remove most of the HTML as you only need a <canvas> and a <script> tag
for THREE.js. You can remove the CSS and the resizing code. You can remove .GLTF
code because you only care about the path. You can remove the lights and the
shadows by using a MeshBasicMaterial. You can certainly remove the lil-gui
code. The code makes a ground plane with a texture. It would be easier to use a
GridHelper. Finally if our question is about moving things on a path we could
just use cubes on the path instead of loaded car models.
Here's a more minimal example taking all the above into account. It shrunk from 271 lines to 135. We might consider shrinking it even more by simplifying our path. Maybe a path with 3 or 4 points would work just as well as our path with 21 points.
I kept the OrbitController just because it's useful for others
to move the camera and figure out what's going on but depending
on your issue you might be able to remove that as well.
The best thing about making an MCVE is we'll often solve our own problem. The process of removing everything that's not needed and making the smallest example we can that reproduces the issue more often than not leads us to our bug.
On top of that it's respectful of all the people's time who you are asking to look at your code on Stack Overflow. By making the minimal example you make it much easier for them to help you. You'll also learn in the process.
Also important, when you go to Stack Overflow to post your question put your code in a snippet. Of course you are welcome to use JSFiddle or Codepen or similar site to test out your MCVE but once you actually get to posting your question on Stack Overflow you're required to put the code to reproduce your issue in the question itself. By making a snippet you satisfy that requirement.
Also note all the live examples on this site should run as snippets. Just copy the HTML, CSS, and JavaScript parts to their respective parts of the snippet editor. Just remember to try to remove the parts that are not relevant to your issue and try to make your code the minimal amount needed.
Follow these suggestions and you're far more likely to get help with your issue.
Use a MeshBasicMaterial
Because the MeshBasicMaterial uses no lights this is one way to
remove reasons something might not be showing up. If your objects
show up using MeshBasicMaterial but not with whatever materials
you were using then you know the issue is likely with the materials
or the lights and not some other part of the code.
Check your near and far settings for your camera
A PerspectiveCamera has near and far settings which are covered in the
article on cameras. Make sure they are set to fit the
space that contains your objects. Maybe even just temporarily set them to
something large like near = 0.001 and far = 1000000. You will likely run
into depth resolution issues but you'll at least be able to see your objects
provided they are in front of the camera.
Check your scene is in front of the camera
Sometimes things don't appear because they are not in front of the camera. If
your camera is not controllable try adding camera control like the
OrbitController so you can look around and find your scene. Or, try framing
the scene using code which is covered in this article.
That code finds the size of part of the scene and then moves the camera and
adjusts the near and far settings to make it visible. You can then look in
the debugger or add some console.log messages to print the size and center of
the scene.
Put something in front of the camera
This is just another way of saying if all else fails start with
something that works and then slowly add stuff back in. If you get
a screen with nothing on it then try putting something directly in
front of the camera. Make a sphere or box, give it a simple material
like the MeshBasicMaterial and make sure you can get that on the screen.
Then start adding things back a little at time and testing. Eventually
you'll either reproduce your bug or you'll find it on the way.
These were a few tips for debugging JavaScript. Let's also go over some tips for debugging GLSL.